

HRM Market Update Q1 Q2 Q3 Single Family Homes Real Estate
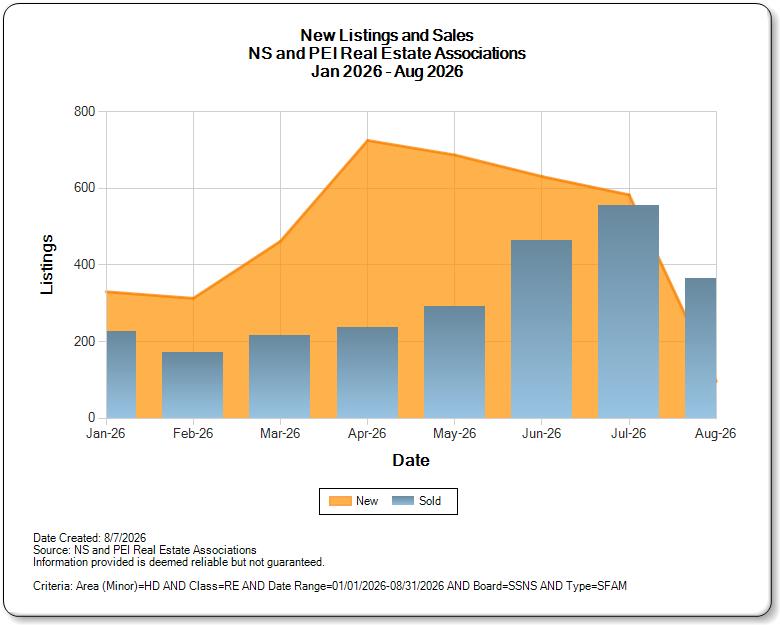
The Halifax Regional Municipality, Nova Scotia 2026 real estate market has been full of surprises so far this year. As you can see by the graph showing residential new listings as compared to solds since Jan 1, 2026, the steady climb of new listings started in late February. While it peaked in April, the spread between new listings and solds stayed aggressively high until the end of May. As of early August, new residential listings are now well below the sold level of single family homes. So what does this mean? Is this just reflecting a Maritime summer seller pause or is our market about to shift in their favour?
With over 1.6 billion dollars sold in total single family residential sales, divided by the 2525 solds (as of Aug 7), the average sold price is currently $653,103. Excluding the lowest plus the $11,000,000 highest sales, the median sold price is $589,900 with an average 38 days on market.
Adding condo sales to the mix increases total sales to 2954 resulting in only a slightly lower average sold price of $628,789 (median sold price $570,000).
From January to April, the average and median residential sold prices (single family and condos) fluctuated around the $600,000 mark, moving up closer to $700,000 for 1 month in May, then steadily declining in June, July and so far in August where it is currently at January levels.
The good news is that market absorption rate is finally only slightly higher than January levels with well priced and presented homes selling relatively faster now than they were during the Spring Market. Earlier in the year, Feb to mid-May had a 5 to 6-month supply of homes, then June and July saw the supply drop to 3-4 months. However, so far in August, with almost 1500 current active total residential listings across HRM, the absorption rate has climbed again to just over 4 months.
Looking at the actual number of residential listings sold each month across the board since Jan 1, the number has fluctuated between 199 (Feb) to 633 (July) sales. As a percentage of active vs sold listings, it has fluctuated between 16.4% (May) to a high of 29.58% (July). In other words, at best, fewer than three in ten active residential listings are resulting a sale.
So again... does all of this mean that our residential market is shifting in favour of buyers or sellers?
- Seller's Market: Above 20%. Demand outpaces supply, competition is fierce, and prices rise quickly. A 30% ratio falls solidly here.
- Balanced Market: Between 12% and 20%. Supply and demand are equal, and prices remain stable.
- Buyer's Market: Below 12%. Supply exceeds demand, giving buyers more negotiation leverage and choices
Since market types are determined by market absorption rates, if 30% of the total active inventory is sold every single month with the entire portfolio of available homes completely sold in roughly 3.3 months, it is technically still a sellers market. But since this appears to be primarily in favour of sellers with properties listed under $750,000 accounting for approximately 80% of sales. (approx 66% under $650,000), I believe we are in a balanced market and will likely remain here until the end of the year.
For sellers maximum profit is understandably the goal yet for buyers, price of course matters but affordability thresholds matter more.
Food for thought...a $650,000 mortgage at approx $3500/mth PI plus property taxes at approx $650/mth...